Pricing a house in Aarhus
Machine Learning in Finance · Session 7
The house
150 m²
living area
1973
year built
5
rooms
villa
type
Aarhus V
postal town
3.6 km
from the cathedral
A buyer has found this house and asks a bank for a mortgage. Before the bank lends, it needs one number: what the house is worth. It sold in January 2024.
Where it stands
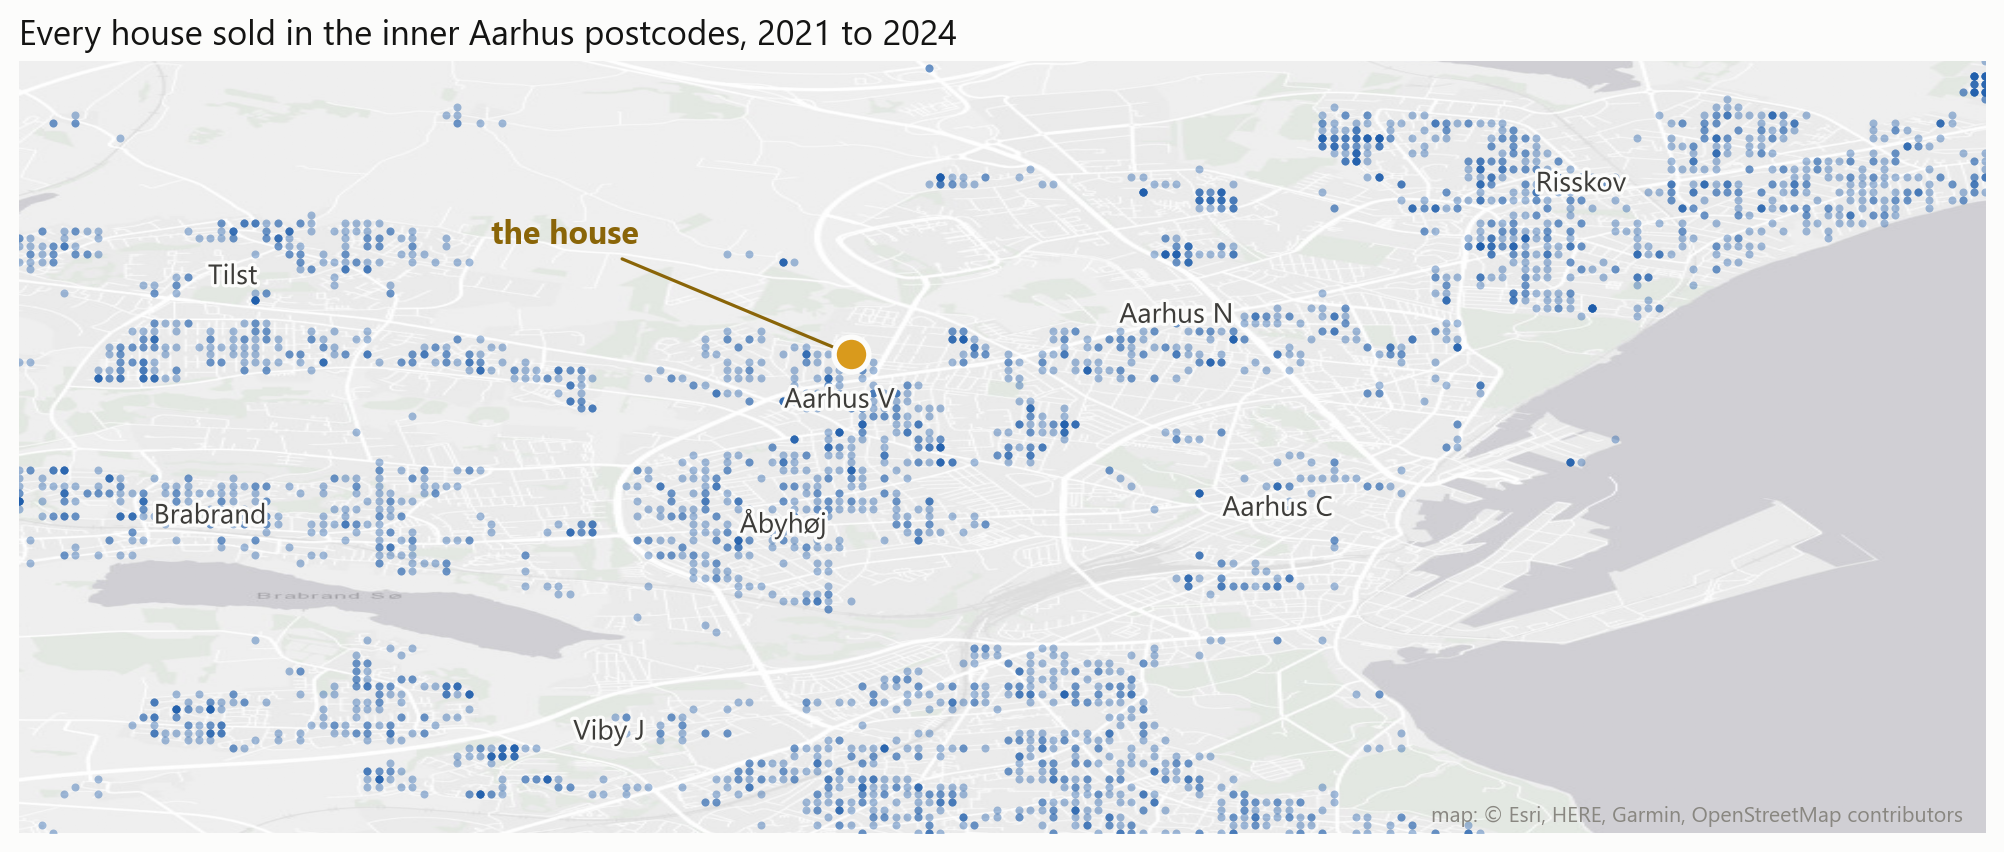
Each blue dot is a sale in the table, placed to within about a hundred metres. The live map zooms to any street in the table.
The street
Drag to look around, and use the arrows to walk down the street. If the frame stays blank, open it in Street View.
Write down a price
150 m²
living area
1973
year built
5
rooms
villa
type
Aarhus V
postal town
3.6 km
from the cathedral
You now have what a buyer has before the viewing: the size, the age, the rooms, the town, the distance to the centre, and the street. What did it sell for in January 2024?
kroner
The number stays in this browser and comes back in Part 6, next to the model’s valuation and the sale price.
What the bank may lend
§ 5 · the limit “Inden for en lånegrænse på 80 pct. af ejendommens værdi kan der ydes lån til følgende ejendomskategorier: 1) Ejerboliger til helårsbrug.”
§ 10 · the value “Realkreditinstituttet skal ansætte en kontantværdi af ejendommen til brug for låneudmålingen. Værdien skal ligge inden for det skønnede beløb, som ejendommen kan handles til … (markedsværdi).”
The bank may lend 80 percent of the value, and must set that value itself, as the price the house would fetch in an ordinary sale.
Lov om realkreditlån og realkreditobligationer m.v., lovbekendtgørelse nr. 1541 (2025), §§ 5 and 10.
What the lender risks
Two numbers score every rule today: the error in kroner, and the share of sales on which a loan of 80 percent of the rule’s value would have exceeded the price.
Who values with a model
The mortgage banks may replace the visit to an owner-occupied home with “en dokumenteret værdiansættelsesmodel”, and may monitor the value of every home they have lent against with one.
The tax authority “bruger et system, der bygger på en matematisk model, til at vurdere landets 2,4 mio. ejendomme”. Its inputs are the living area, the year built, the surroundings and “salgspriser for ejendomme i området”.
A coefficient, in its words “Fra data om salg af ejendomme i hele landet ved vi, hvor meget forskellige forhold gennemsnitligt påvirker salgsprisen på en ejendom.”
When it goes wrong Zillow wound down its house-buying business in 2021 after its model overpaid: a 304 million dollar write-down in one quarter. “The unpredictability in forecasting home prices far exceeds what we anticipated.”
Bekendtgørelse nr. 807 (2022) om værdiansættelse af pant og lån i fast ejendom, §§ 5 and 33 · vurdst.dk and vurderingsportalen.dk · Zillow Group, Form 8-K, 2 November 2021.
Today, in six steps
Part 1Look at the market: the file, one column, a mask, a number per town, a map and a scatterpandas · matplotlib
Part 2Rules by hand: a price per square metre as a loop, as one line, as a function, and over timeloops · dicts · def · a line
Part 3A first model: the sealed 2024 sales, two rules that need no model, a fitted linefit · predict · RMSE
Part 4Choose columns without touching the 2024 salesKFold · cross_val_score
Part 5Location as text turned into numbers, a penalty chosen by grid search, the logget_dummies · GridSearchCV
Part 6Value the house, renovate it, move it across town, and find where the model failspredict · copy · a loop
Nothing here is new. Open the deck on your own laptop: every cell runs and can be edited. A slide marked play holds a working cell to change as you like; a slide marked your turn has its answer on the slide after.
The data
7,621
house sales
22
postal towns
15 quarters
Jan 2021 to Sep 2024
13
columns
These are ordinary sales of villas and townhouses in the Aarhus postcodes, with family transfers and auctions left out, from the public sale records as collected by boliga.dk. Each house is placed by the national address register; addresses are dropped and locations rounded to about a hundred metres.
1 · Looking at the market
Part 1
The file, one column, a question asked of every row, a number per town, a map and a scatter.
Reading the file
The table has one row per sale and thirteen columns. The rows are in date order, so the 2024 sales sit at the bottom.
The columns
| price | the sale price, in kroner | zip | the postcode |
| area | living area, m² | centre_km | kilometres from the cathedral |
| rooms | number of rooms | sold · quarter · date | when the sale happened |
| built | the year the house was built | lat · lon | the location, to about 100 metres |
| type · town | villa or townhouse; one of 22 postal towns |
Six of the columns describe the house. price is what the model has to produce, sold decides which rows it may learn from, and lat and lon are for the map.
One column
A column on its own is a Series with its own methods. The mean sale is 450,000 kroner above the median: a few very expensive houses pull it up, and the most expensive of all sold for 43.3 million.
The most expensive sales play
Sort by a column, then take the top of the table. Change the cell: the cheapest three, the oldest, the largest, the newest, or the most expensive in your own town.
A question asked of every row
The comparison inside the brackets is asked of every row, and only the rows that answer True are kept: 820 sales in Risskov, with a median of 5.05 million kroner.
A number per town
Split by town, take the median of each part, and put the answers back in order. The median in Aarhus C is two and a half times the median in Trige.
Where Aarhus is expensive
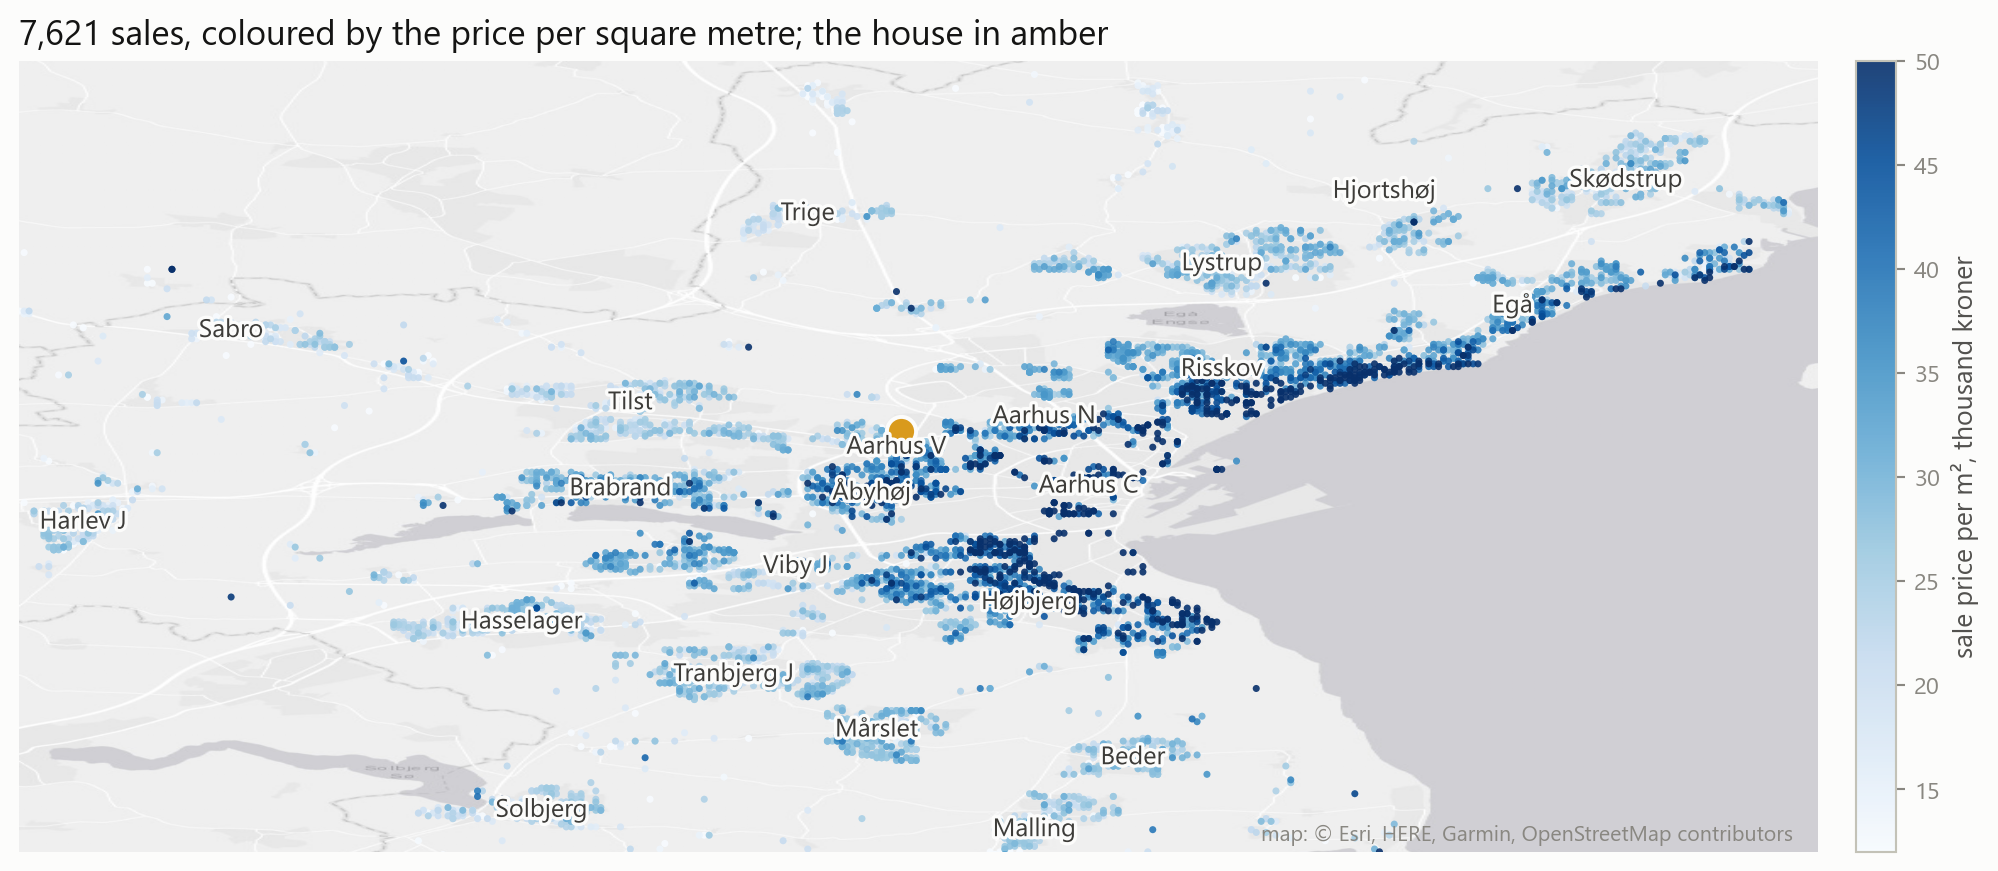
The price per square metre runs from 18,900 kroner in Sabro to 52,400 in Aarhus C, and it falls with the distance from the centre and rises towards the bay.
Drawing the market play
Every dot is a sale. Swap in built or centre_km, or keep one town only.
The shape of the prices
The prices have a long tail to the right, as market values and trading volumes have. In logs the tail is gone, which matters once a model is fitted to them.
2 · Rules by hand
Part 2
The price per square metre, the number every Danish listing quotes: as a loop, as one line, as a function, and quarter by quarter.
One house, by hand
.iloc[0] picks the first row: a 222 square metre villa in Højbjerg that sold for 7,995,000 kroner, which is 36,014 kroner per square metre.
Every house, with a loop
This is the accumulator pattern: an empty list, then one row per turn of the loop and one append. The loop runs 7,621 times.
Every house, in one line
Dividing one column by another divides row by row, and the result is a new column. The loop and the one line give the same numbers; the one line runs the loop in compiled code. The median is 27,321 kroner per square metre.
A dictionary, one entry per year
A mask runs inside the loop, and a dictionary collects the answers by name. The same shape of loop can collect anything: a count, a median, a share.
Your turn 1
In 2022 the yield on Danish mortgage bonds went from 1.5 to 3.7 percent, and on to 4.8 in 2023. Fill a dictionary with the median price per square metre in each year, then get the same numbers in one line with groupby.
Your turn 1: answer
Mortgage rates tripled, and the median price per square metre in Aarhus moved by 500 kroner. Fewer houses changed hands: 2,532 sales in 2021 and 1,834 in 2022.
The market over time play
One median per quarter, joined by a line. Put .size() in place of ['per_m2'].median() and the number of sales per quarter appears instead.
A function that describes a house
The function takes one parameter, builds one f-string and returns it. The comma in :,.0f groups the thousands.
Your turn 2
Describe the three most expensive sales, one line each, using describe inside a loop.
Your turn 2: answer
594 m² villa, built 2006, Risskov: 43,300,000 kr
433 m² villa, built 1907, Aarhus C: 30,100,000 kr
325 m² villa, built 1915, Højbjerg: 19,200,000 kr
A function written once is called three times by the loop. Calling it for all 7,621 houses would change only the number in range.
3 · A first model
Part 3
The rows to learn from, two rules that need no model, and a fitted line: a split, an error in kroner, fit and predict.
Two functions for scoring a rule
The first is the root mean squared error, in kroner. The second compares 80 percent of every valuation with the price the house sold for; the comparison is a mask, and the mean of a mask is a share.
The rows to learn from, and the rows to check on
A bank valuing a house in 2024 has the sales up to 2023. The 1,409 sales of 2024 stay sealed until a rule has been chosen, and then score it once.
Rule one: every house is worth the average
The rule is off by 1.9 million kroner on a typical house and underwater on 40 percent of the 2024 sales. Every other rule has to beat these two numbers.
Rule two: a price per square metre
This is the rule of thumb from Part 2, computed on the training rows only. It cuts the error to 1.63 million and the underwater share to 30 percent.
Fitting a line
The three steps are import, create and fit. The line starts at 234,000 kroner and adds 27,326 for every square metre.
Predicting
The error is 1,629,763 kroner, 5,000 better than the rule of thumb. Area on its own explains part of the spread in prices, and a straight line through it cannot do more.
The line, drawn
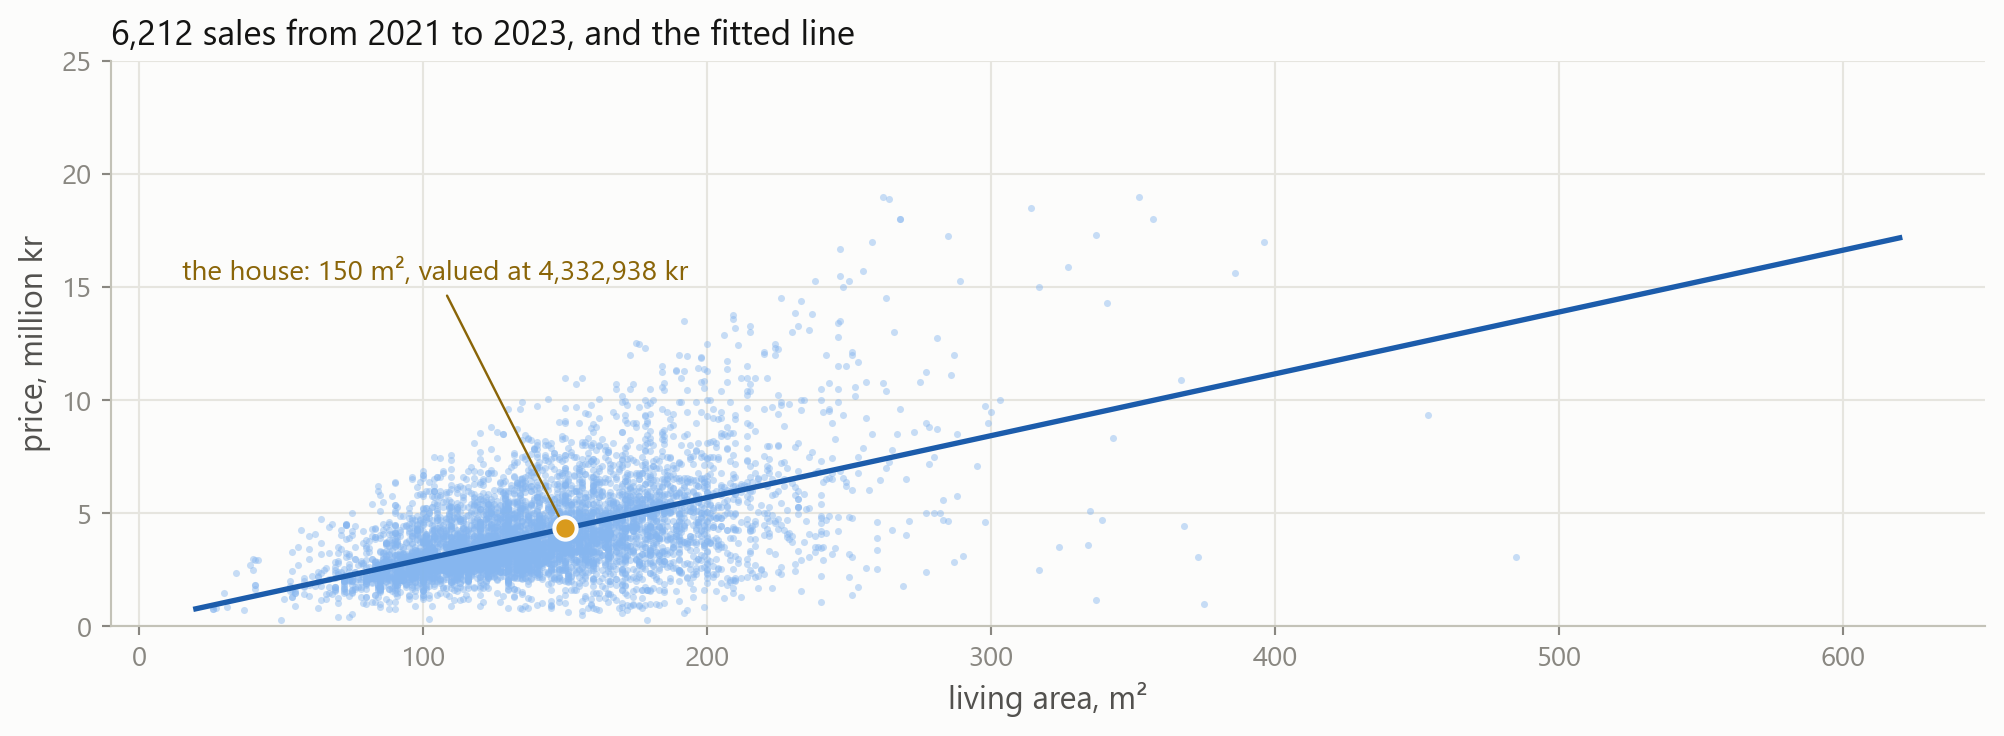
Every dot is a sale in the training rows. The line values the house from the first slide at 4,332,938 kroner; the dots at 150 square metres run from 1.5 to 8 million.
One column at a time play
On its own, every kilometre from the cathedral takes 215,520 kroner off. Swap the column for built or rooms, then put two columns in the list at once. Which pair gets the error below 1.4 million?
Area, and the distance to the centre
Together the two columns bring the error to 1.39 million and the underwater share to 25 percent. Every kilometre from the cathedral now takes 249,000 kroner off with the area held fixed, which is the bid-rent curve of urban economics, measured on 6,212 sales.
4 · Choosing columns
Part 4
Which of the numeric columns belong in the rule, decided without touching the 2024 sales: KFold, cross_val_score, and a loop over candidates.
The folds
Trying each set of columns on the 2024 sales and keeping the best would use the test rows up. Instead the training rows are cut into five blocks, each block takes a turn as the validation block, and the five errors are averaged. Houses are interchangeable rows, so a shuffled KFold is right here; a time series needed TimeSeriesSplit.
Candidates, in a loop play
Candidates go in and errors come out: built takes 6,000 kroner off and the distance to the centre 270,000. Add your own. Does rooms help?
The chosen rule, on the 2024 sales
The rule scores 1.39 million kroner and 24 percent underwater. The 2024 sales were opened once, after the choosing was done, so these two numbers are a fair report.
Three coefficients
A square metre is worth 29,624 kroner and a year of age costs 2,138, each with the other columns held fixed. Every kilometre from the cathedral takes 253,683 kroner off.
5 · Location, and a penalty
Part 5
What the three columns cannot see, two columns of text turned into numbers, a penalty chosen by grid search, and the log.
What the three columns cannot see
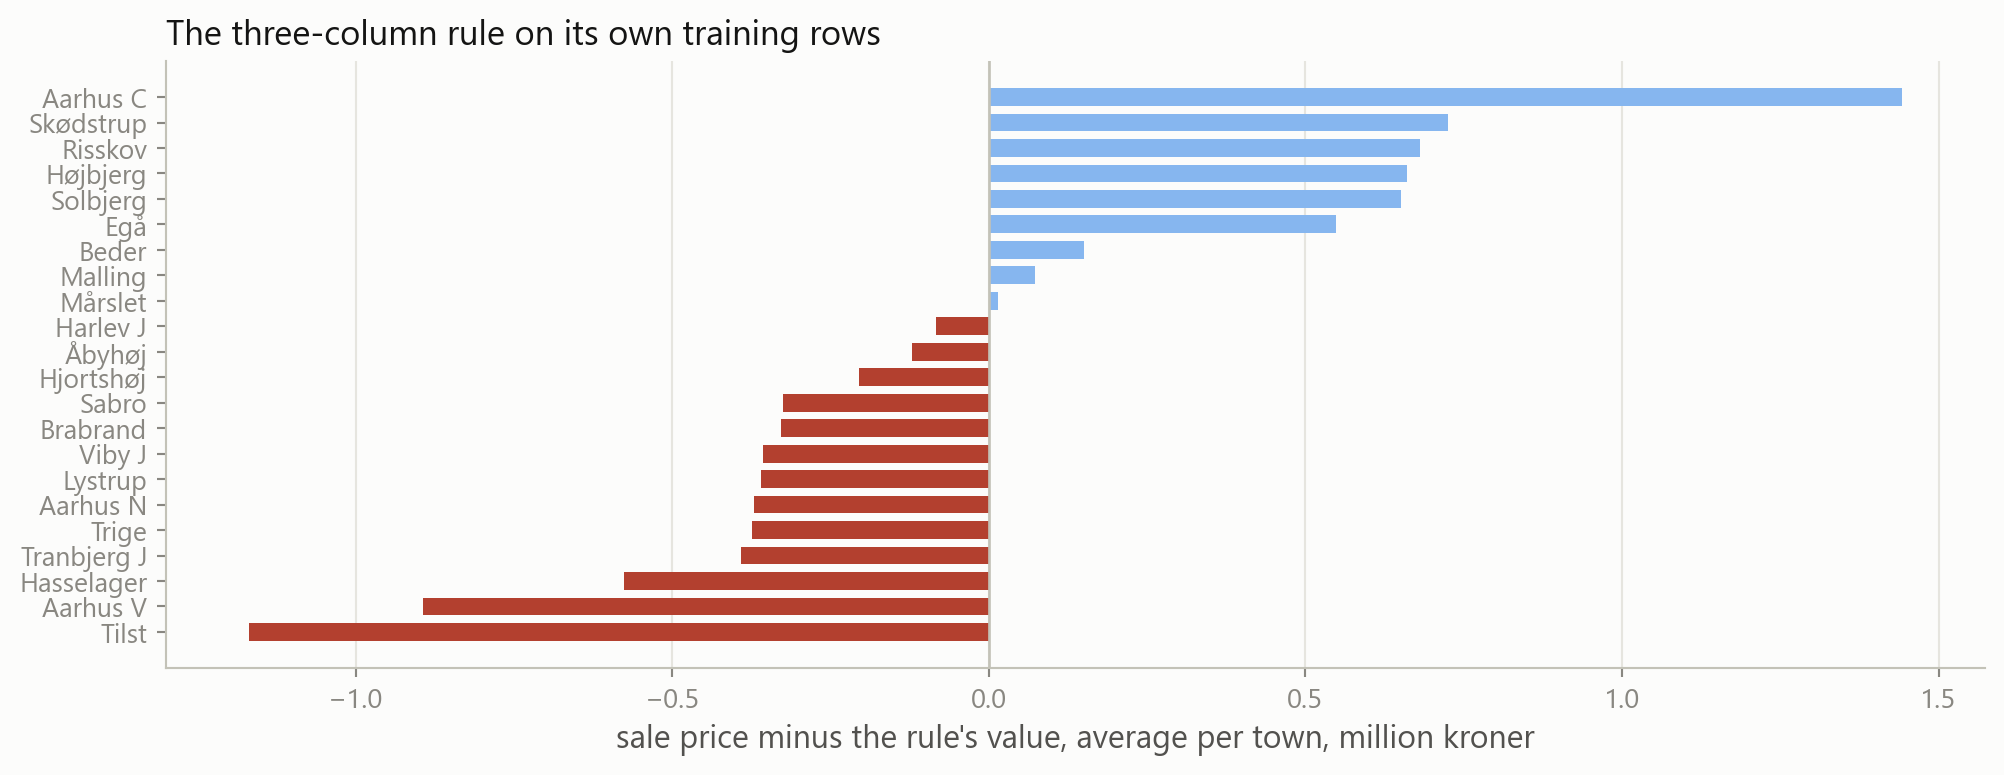
On its own training rows the rule undervalues Aarhus C by 1.4 million kroner on average and overvalues Tilst by 1.1 million. The distance to the cathedral is not the whole of location.
Text into numbers
Two columns of text became twenty-four columns of zeros and ones, one per town and one per type. The loop collects every column except the target and the ones that only identify the sale.
All twenty-eight, unpenalised
The error on the 2024 sales is 1.25 million kroner, 140,000 better than the three columns, with 19 percent underwater. Training and test errors are close: 6,212 rows against 28 columns leave little room to overfit.
A penalty, chosen by grid search
The grid picks alpha 10, and the test error moves by 400 kroner. With two hundred rows per column the penalty has little to do; with nineteen near-copies of one volatility it had a lot.
What the lasso keeps play
At alpha 100,000 the lasso keeps twelve of the twenty-eight columns: area, centre_km, the type and eight of the towns, with built set to exactly zero. Raise alpha until five remain, then print kept to see which.
The log of the price
This is the same grid search on np.log(price), with the predictions brought back by np.exp. In logs the model fits percentages rather than kroner: the error in kroner is 11,000 worse and the underwater share falls from 19 to 15 percent. This is the rule a lender would keep.
The error, rule by rule
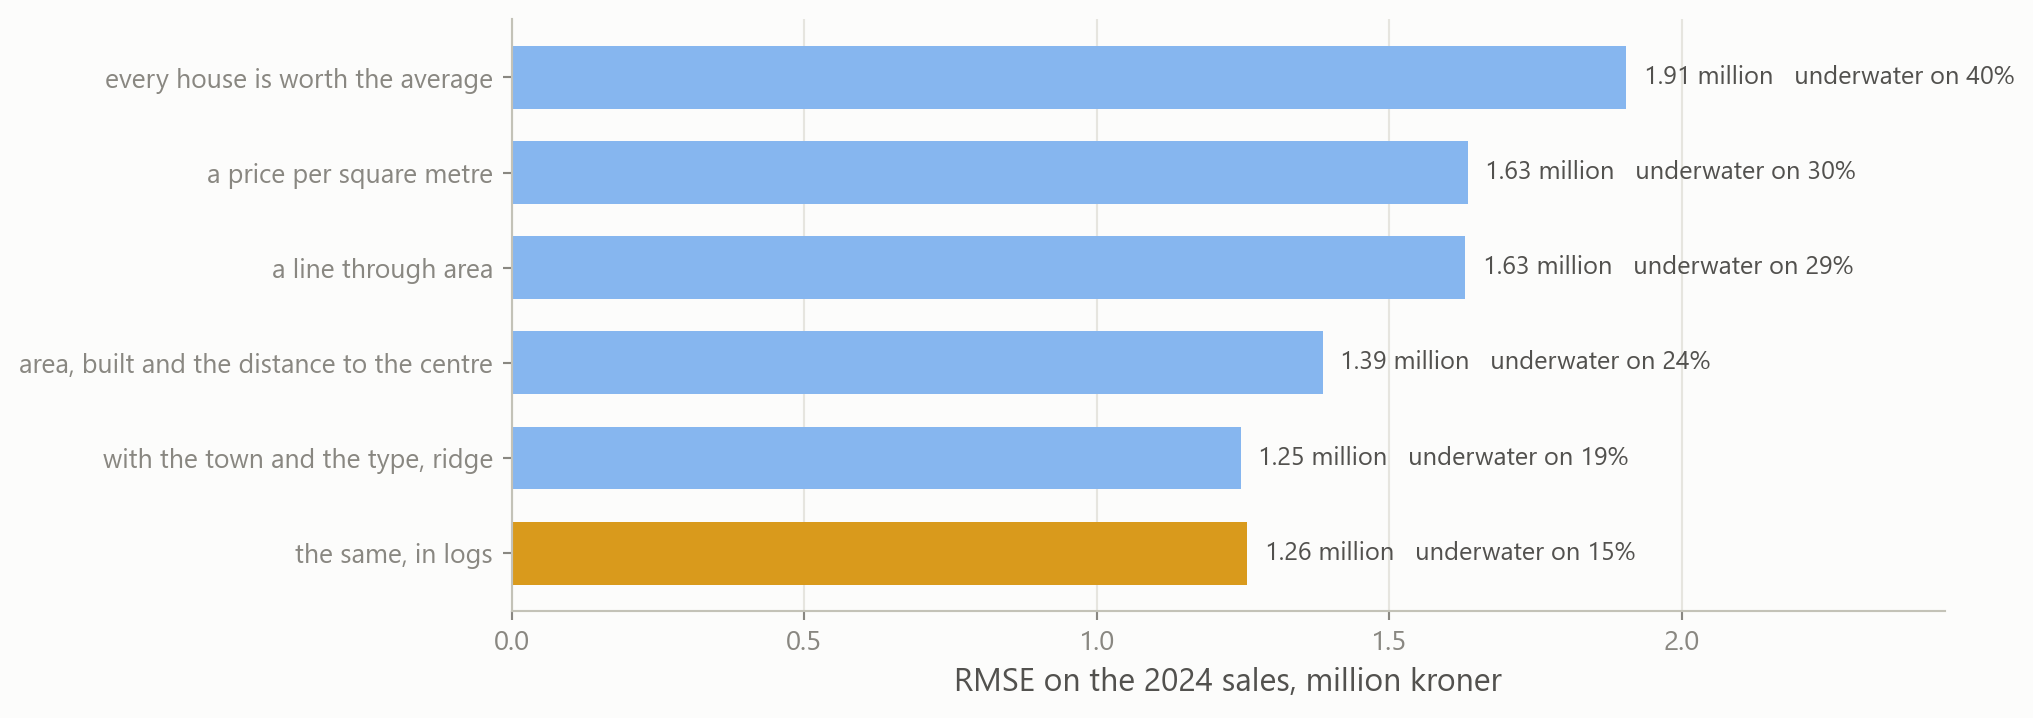
Six rules were scored on the same 2024 sales. The share of loans underwater fell from 40 percent to 15, and no tool used on the way was new today.
What is missing
The house itself bathrooms, the plot, the basement, the roof, the heating, the year of the last renovation. All of it is in the building register, BBR, which the tax authority’s model reads and this table does not.
The condition two houses of the same size and age on one street sell far apart when one has a new kitchen and the other a leaking roof. No register holds that.
Six columns are off by 15 percent on a typical house. The tax authority’s model has dozens of columns, and a bank still sends someone to look.
6 · One house
Part 6
The house from the first slide, valued against your guess and its sale price, renovated, moved across town, and the sales the model gets most wrong.
A valuation function
The mask keeps the 2024 sales in Aarhus V and .head(1) the first of them, as a table with one row, which is what .predict() needs. That is the house from the first slide: the model values it at 4,341,389 kroner, and a bank lending 80 percent would offer 3,473,112.
The price
your guess
no guess entered
the model
4,341,389 kr
sold for
3,800,000 kr
No guess was entered on the Write down a price slide.
The model was 541,389 kroner above the price, 14 percent.
The house sold on 20 January 2024 for 3,800,000 kroner.
A typical miss
The model is 14 percent high, and that is a typical miss: the rule is within 10 percent of the price on a third of the 2024 sales and within 20 percent on two thirds. The loan, 3,473,112, was still below the price.
Renovate it play
Thirty square metres more are worth 639,336 kroner to the model; .copy() first, so the original row stays as it is. Try a sixth room, a build year of 2000, two kilometres closer to the cathedral, or a townhouse (type_villa 0, type_townhouse 1).
The same house, in every town
The inner loop clears every town column, the next line switches one on, and the house moves to that town’s typical distance. It is worth 2.6 million kroner in Sabro and 7.6 million in Aarhus C.
The location premium, drawn
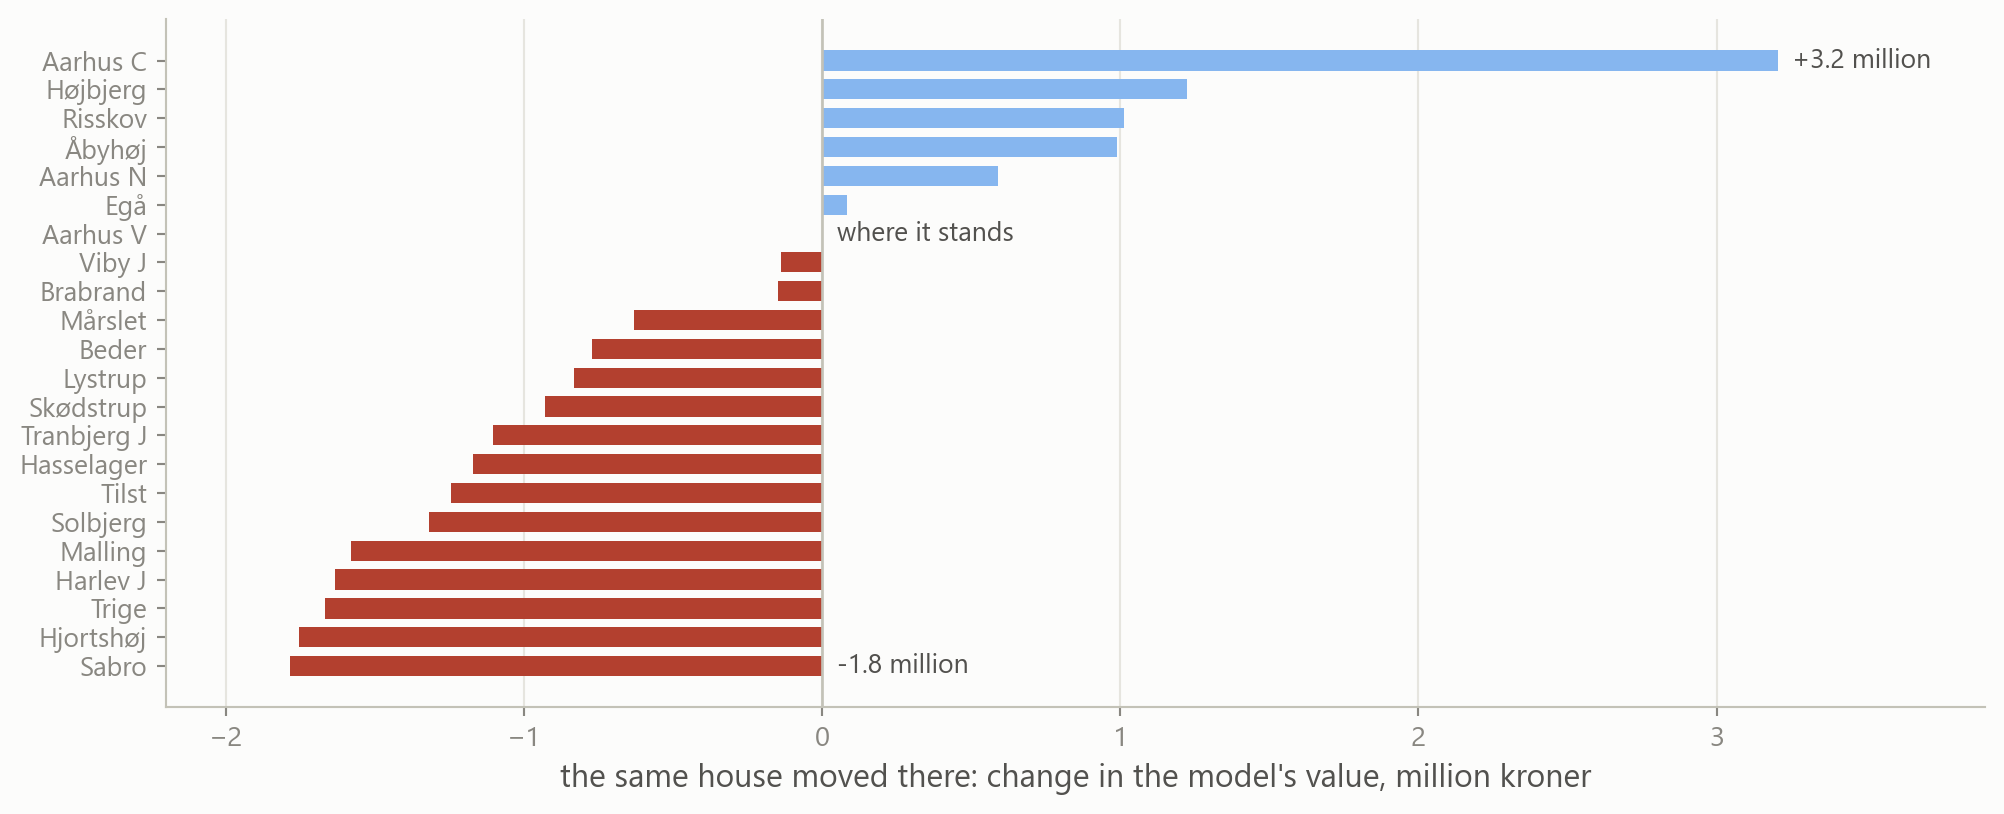
Size, age and type are held fixed, so the bars differ only by the town and its distance from the centre. Between Sabro and Aarhus C the gap is 5.0 million kroner.
Where the model is most wrong play
The three largest misses are houses of 330 to 380 square metres, valued at 12 to 14 million and sold for 6 to 8. Look at the other end with .tail(3): which houses sold for far more than the model’s value?
Valued against sold
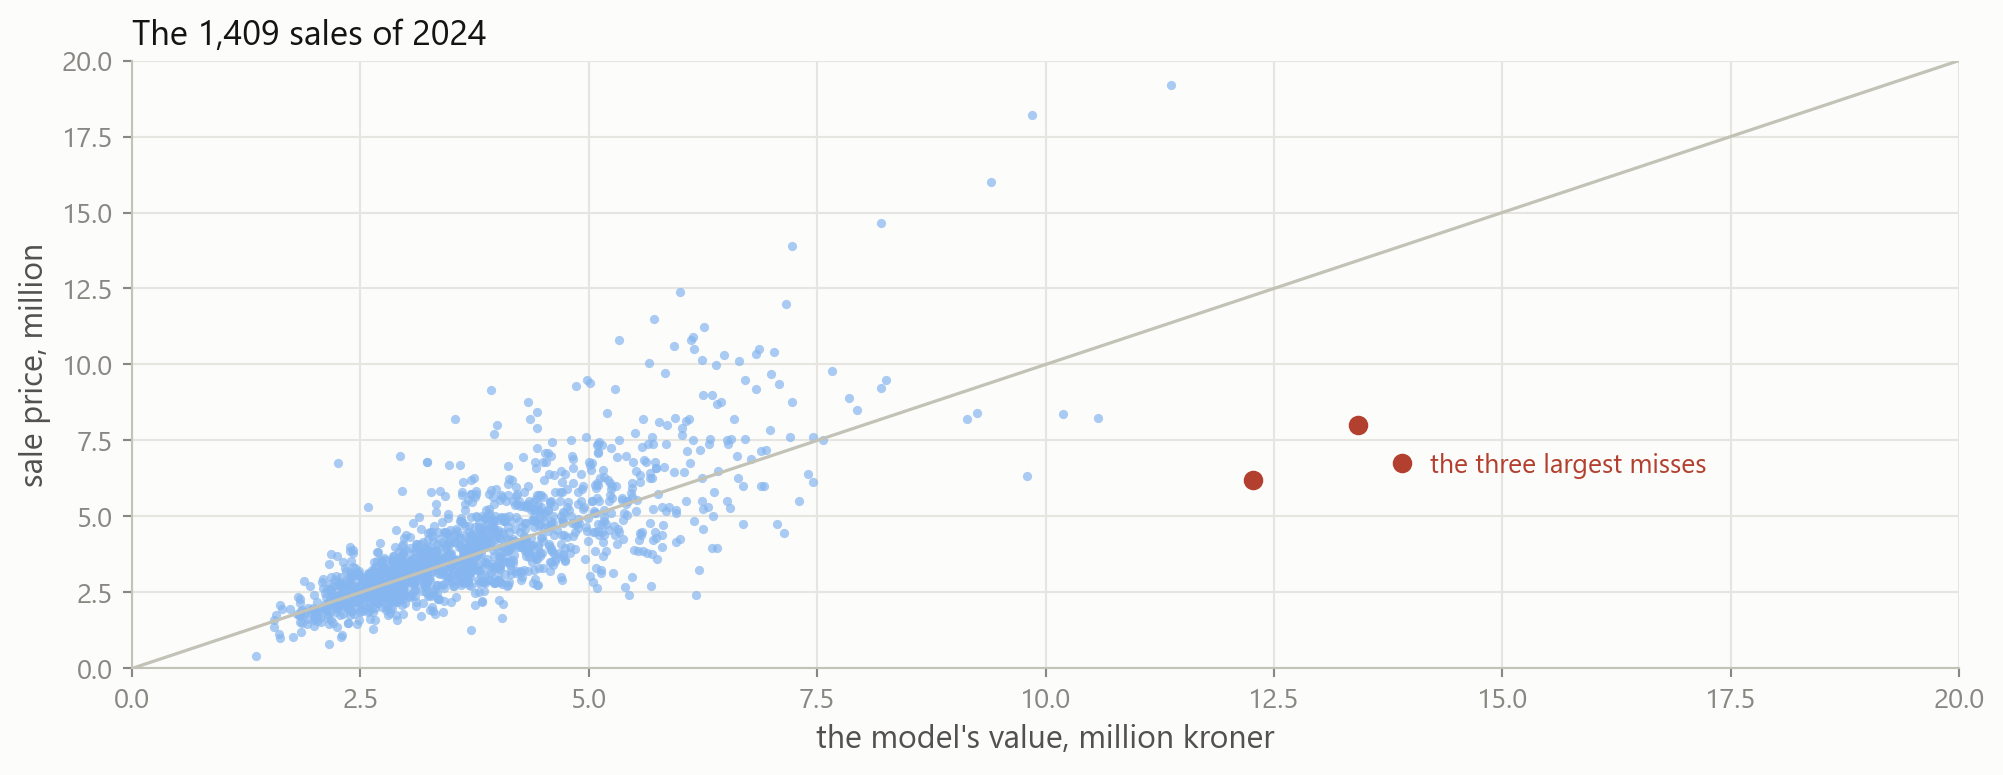
A dot on the grey line is a house valued at exactly its price. The cloud widens as prices rise: above 8 million the six columns say less and less about what a buyer paid.
A letter from the bank
One function wraps the model, the lender’s rule and the formatting. A loop over worst.index would write the letter for the three houses the model got most wrong.
Everything used today
Looking at a table read_csv, a column’s mean and median, a mask asked of every row, groupby for a number per town, sort_values and head, a scatter, a histogram and a line.
Loops, dictionaries, functions The accumulator pattern over 7,621 rows, a dictionary filled by a loop, def with an f-string, and the vectorised line that replaces the loop.
A split and two scores The 2024 sales sealed until the end; RMSE in kroner, and the share of loans underwater, which is the mean of a mask.
Two rules that need no model The average price, and a price per square metre. Every model has to beat them.
fit and predict LinearRegression on one column, two and three. Coefficients in kroner per unit, with the other columns held fixed.
Choosing without the test rows KFold for interchangeable rows, cross_val_score, a loop over a dictionary of candidates.
Text, penalties and logs get_dummies for the town and the type, a Pipeline with StandardScaler, GridSearchCV over alpha, the lasso’s zeros, and np.log on a skewed target.
Using the model A one-row table into .predict(), .copy() and change one column, a loop that moves the house, the largest errors by sort_values.
Where this goes next
beforefitting, choosing by cross-validation, and holding coefficients smallregression
nowone investigation from the raw file to a valued house, with every tool so fara recap
nextclassification, where the target is a label: will this borrower repay?logistic regression
thentrees and ensembles, with more settings and the same grid searchthe same workflow
The split, the baselines, the folds, the grid and the sealed test rows stay exactly as they were today. Only the model inside them changes.
Before the next session
- There are no exercises and no case this time. Open this deck again at home and keep changing things: value a house in your own town, make 2023 the test year, add a candidate, move the grid.
- Finish any earlier exercise set you skipped. The loops, functions and masks in the early sets are what carried every step today.
- Read the case notebooks from Part 1 to Part 6 in one sitting, as one investigation.
Stuck? Ask a friend, ask an AI for a hint rather than an answer, or email jobo@econ.au.dk.