Electricity prices in West Denmark
Machine Learning in Finance · Session 10
Two years of prices play
Each point on the line is one day’s average price in 2022 and 2023, the years the models learn from. Click, drag or step to see a day’s 24 hours.
The question for 2024
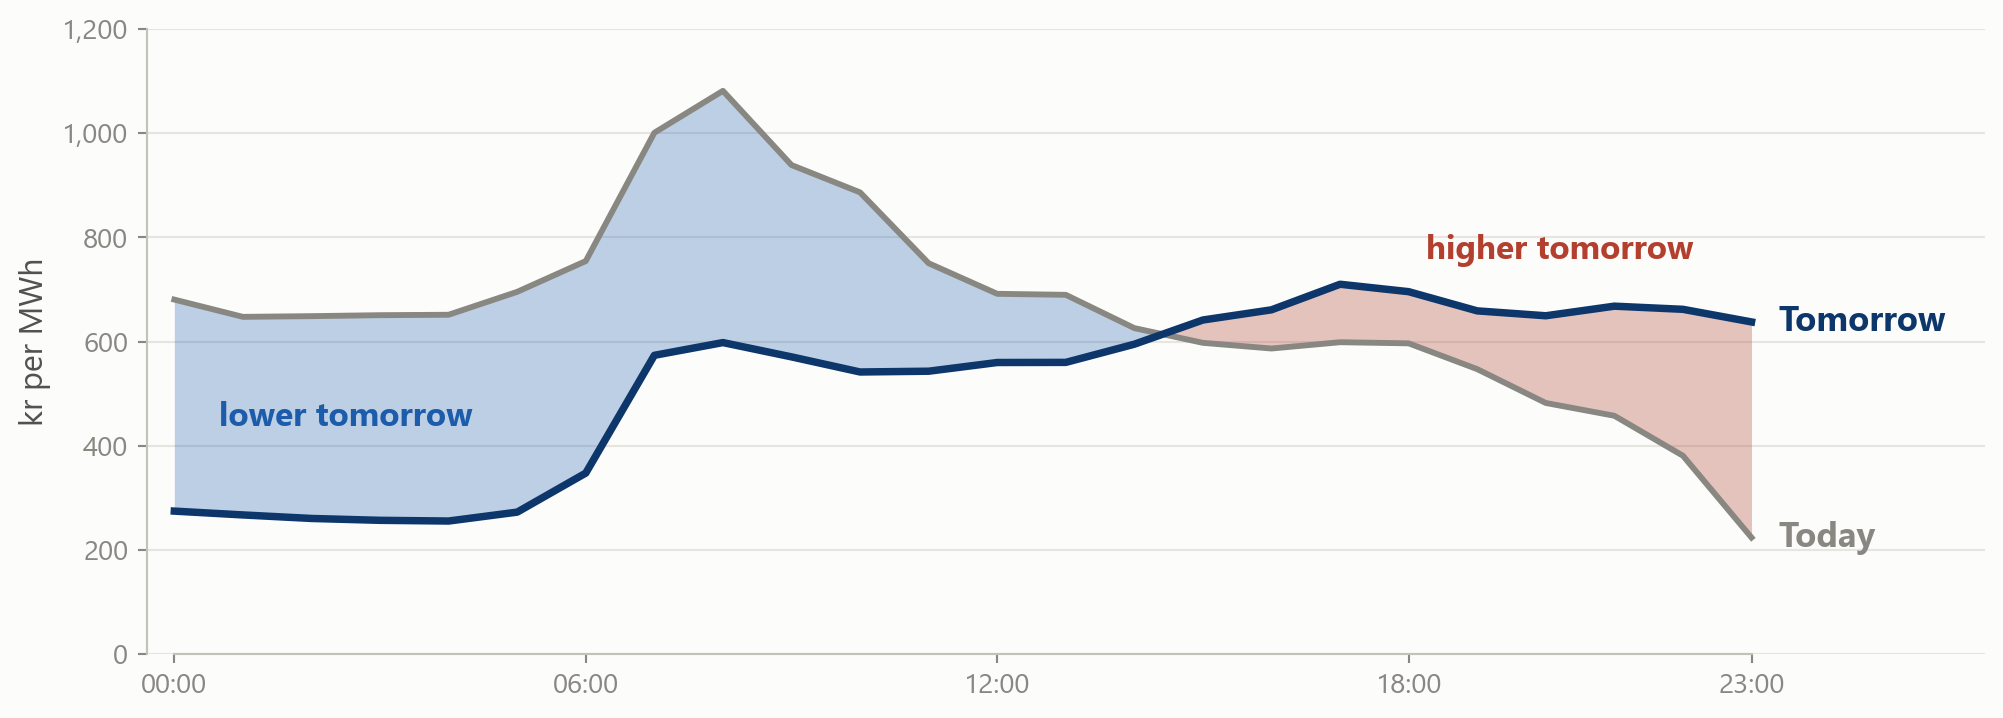
Will tomorrow’s price at this hour be higher than today’s? In this example the answer is no until 14:00, and yes from 15:00.
Your forecasts for 2024 play
| tomorrow, at the hour | price yesterday, kr | price today, kr | wind forecast today, MW | wind forecast tomorrow, MW | how likely is tomorrow's price higher than today's? |
|---|
The models see the same numbers and the weekday. Your answers stay in this browser.
Set how likely tomorrow’s price is to be higher than today’s, at each of these eight hours. Your answers are kept, and two models answer the same hours at the end.
The spot price on a household bill
578 kr
170 kWh in August 2022
109 kr
170 kWh in August 2023
93 kr
170 kWh in August 2024
On a spot-price contract a household pays each hour’s price, plus tariffs and taxes. For 170 kWh, the spot part cost 578 kroner in August 2022 and 93 in August 2024.
Where the power flows play
00:00
Arrows: power on each cable, MW, pointing the way it flows. Cables drawn schematically.
Denmark is two price areas, joined to five neighbours by cable. The auction sends power from cheaper areas to more expensive ones, as far as the cables allow.
Today, in six steps
Part 1The market: the auction, the file, a price per year, prices below zero, a year hour by hourpandas · matplotlib
Part 2Why the price moves: the hour, the month, the wind, today against tomorrow, the S&P 500groupby · pd.cut · a loop
Part 3A first classifier: the label, a rule of thumb, the weekday as seven columns, today’s moveshift · LogisticRegression
Part 4What it is worth: a bet on the direction, the threshold and the cost in kronera function · a loop
Part 5The crisis in the training rows: a label on the level, two training windows, the probabilities checkedBrier · calibration
Part 6Similar hours: three classes, a big move either way, k-nearest neighbours, a feature lab, your forecasts revised and scoredabs · KNeighborsClassifier
One pattern is new, shift inside groupby, and it is explained where it first appears. A slide marked play has controls to click, slide or tick; a slide marked your turn has its answer on the slide after.
1 · The market
Part 1
How one auction sets 24 prices a day, the file, a price per year, prices below zero, and a year hour by hour.
The day-ahead auction
At noon today one auction sets all 24 of tomorrow’s prices, and today’s are already known. The forecast in the file comes out at 18:00 and stands in for a bidder’s own.
The merit order play
The offers are stacked from cheapest to most expensive, and the last one needed sets the price for all. Wind bids near zero; the blocks are stylised.
Reading the file
The table has 26,133 rows, one per hour from 2022 to 2024. With time as the index, .loc picks out a day, a month or a year.
The columns
| price | the day-ahead price in West Denmark, kroner per MWh | wind | the forecast of wind output, MW |
| date | the day, as text: 2024-10-04 | solar | the forecast of solar output, MW |
| hour | the clock hour, 0 to 23 | time | the index: the hour, Danish time |
| weekday | 0 for Monday to 6 for Sunday | weekend | 1 on a Saturday or a Sunday |
Seven days with no published forecast are left out. On the day the clocks go forward there are 23 hours, and on the day they go back the repeated hour is averaged.
A price per year
The average hour cost 1,630 kroner in 2022 and 531 in 2024, a fall of two thirds. The most expensive hour, at 17:00 on 12 December 2024, cost 6,982.
Prices below zero
The price was below zero in 360 hours of 2024, so buyers were paid to take the power; the lowest, in July 2023, was 3,277 kroner below zero.
Hours above or below a price play
Slide the price and switch between below and above. Above 1,000 kroner there were 6,086 hours in 2022, and 525 in 2024.
2024, hour by hour play
Each column is a day of 2024 and each row an hour. Step through the days or click one to draw its 24 prices; the dark bands are the daily peaks.
2 · Why the price moves
Part 2
The hour of the day, the month, the wind, today against tomorrow, and the size of the moves from one day to the next.
The shape of a day
The average price peaks at 08:00 and 19:00, when demand peaks, and is lowest at 03:00 and 14:00.
The shape, month by month play
Step through the months, and switch between weekdays and weekends. At weekends the morning peak almost disappears: 08:00 averages 777 kroner, against 1,274.
Wind, sun and the price play
More wind lowers the median price in every year. The sun lowers it only when strong: above 1,000 MW the median is 348 kroner, against 722 with no sun.
Today and tomorrow play
More wind tomorrow is blue, and so is a lower price, so the two panels mostly line up. On Monday 8 January they do not, and every hour rose.
Daily moves, power against the S&P 500
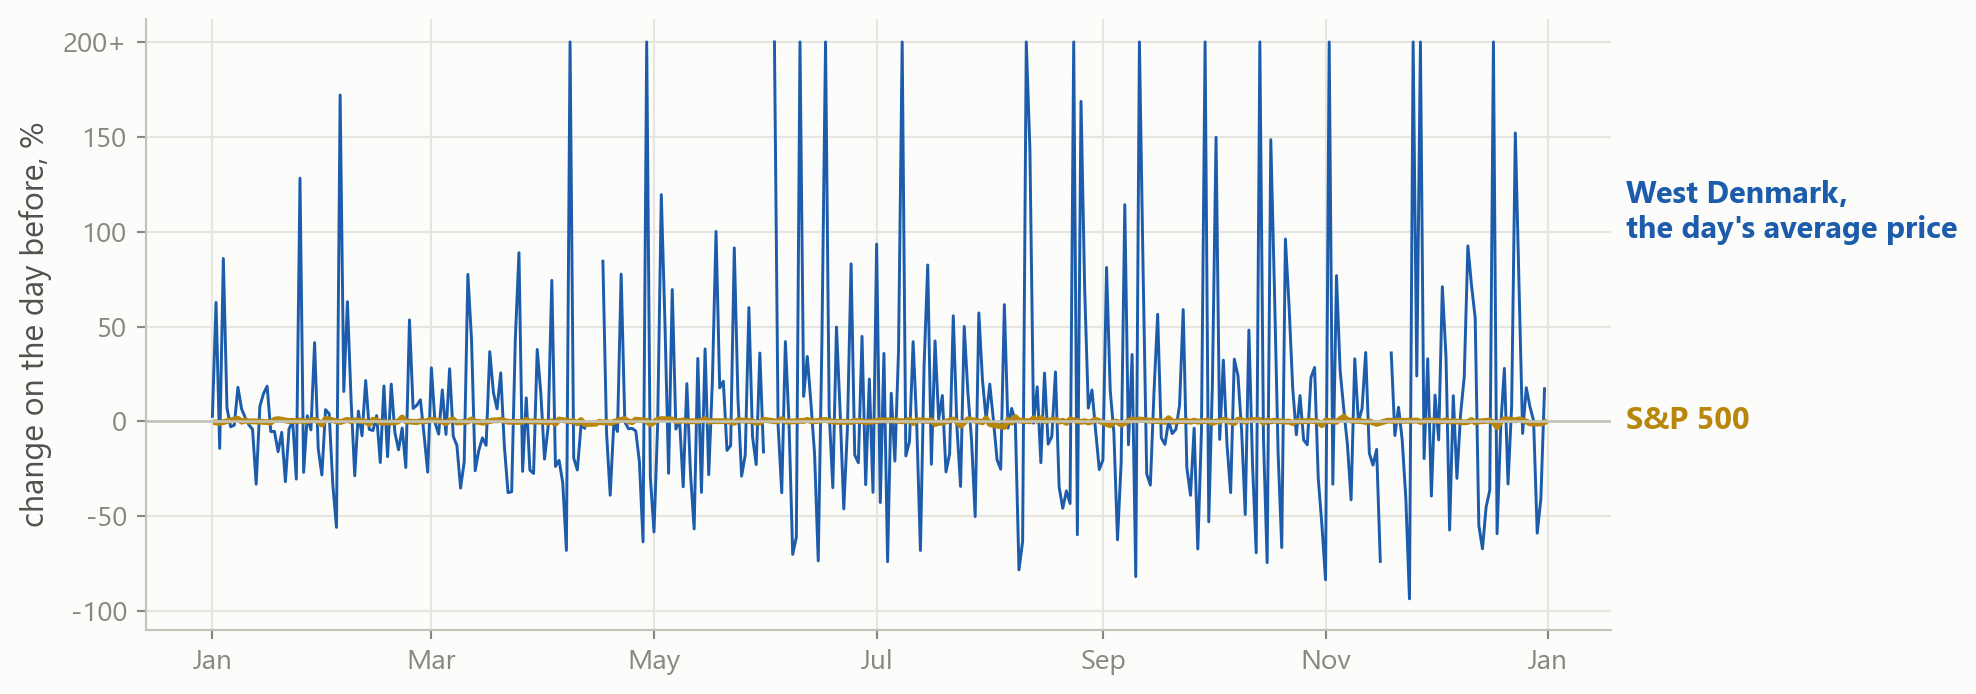
The day’s average price moved more than 20 percent from the day before on 204 days of 2024. The S&P 500’s largest daily move that year was 3.0 percent.
Your turn 1
Fill a dictionary with the median price at 03:00, 08:00, 13:00 and 18:00, then get all 24 medians in one line with groupby.
Your turn 1: answer
3 626.47
8 844.57
13 550.56
18 895.19
The mask inside the loop keeps one hour at a time, and groupby does all 24 at once. The median at 18:00 is 43 percent above the median at 03:00.
3 · A first classifier
Part 3
The question from your forecasts as a label, a rule of thumb, the weekday as seven columns, and today’s move.
The same hour, one day earlier
Within each hour, shift(1) moves the prices down one row, so each row gets the day before’s price. Returns within each ticker were built the same way.
The label
An hour’s label up is 1 when it costs more than the same hour the day before. The first day of the table has no day before, so its price_before is empty.
The wind change
wind_change is tomorrow’s wind forecast minus today’s. When it falls by more than 1,000 MW, 86 percent of hours rise; when it rises that much, 12 percent.
The logistic curve play
The dots are the share of hours that rose, and the red curve is a logistic regression on the wind change. Drag the slider to read its probability.
The weekday, as one number or seven columns play
AUC on 2024
As one number, the weekday can only tilt the week one way. As seven columns, each day gets its own level, and the dots sit on the bars.
Weekday columns in code
get_dummies turns the weekday into seven columns of zeros and ones, and the loop copies each into the table and keeps its name. On every row exactly one of them is 1.
Today’s move
shift(2) reaches two days back, so change_before is today’s move. After a fall of over 200 kroner, 60 percent of hours rise; after such a rise, 42.
The rows to learn from
dropna removes the first two days, which have no day before. Calling no hour of 2024 up, the majority rule, is right 50.3 percent of the time.
A rule of thumb
The rule says up whenever tomorrow’s wind forecast is lower than today’s. It is right 71.9 percent of the time in 2024, against 50.3 for the majority rule.
Logistic regression on the wind change
With one column the model ranks the hours in the same order as the wind change itself: an AUC of 0.796. What it adds is a probability for every hour.
Adding columns one kind at a time
Each step adds one kind of column, and the AUC rises from 0.796 to 0.833. After the loop, p holds the probabilities of the last model, the one with all three.
Choose the columns play
AUC on the folds of 2022 and 2023, where the columns are chosen. Dashed: the model on the slides.
Tick the columns the model may use; each tick shows what it adds on the folds of 2022 and 2023. The dashed line is the model on the slides.
C on the folds
The folds move forward in time. Every C from 0.01 to 10 scores 0.815 on them, so the penalty barely matters here.
C, as a slider play
A small C pulls every coefficient toward zero and the probabilities toward one half. At 0.0001 the ranking barely changes, but the Brier score rises from 0.167 to 0.211.
The confusion matrix
At one half the model catches 3,171 of the 4,303 hours that rose, a recall of 0.737. When it says up, it is right 74.5 percent of the time.
Predictions and mistakes, 2024 play
On 143 of 2024’s 361 days, at least 20 of the 24 hours moved the same way. The model was right on 85 percent of those hours, and on 68 percent of the others.
The same question for the S&P 500
74.4%
power, 2024: hours called right by the model
50.3%
power, 2024: the majority rule
50.4%
S&P 500, 2024: days called right from yesterday’s return and the weekday
58.7%
S&P 500, 2024: always saying up
A share can be bought today and sold tomorrow, so a rise anyone can predict is bought away before it happens. Power cannot be stored in bulk, so tomorrow’s hour is a different good.
4 · What it is worth
Part 4
A bet on the direction of every hour, the kroner in each cell of the confusion matrix, and a threshold set by the cost of trading.
A bet on the direction
For each hour of 2024, bet 1 MWh on the direction: long when the probability is high, short when it is low. Each trade earns the move and pays a cost of 50 kroner.
The move in each hour
Knowing every direction in advance, with no cost, would earn 1,868,568 kroner in 2024. Always going long earns 514, because the rises and falls almost cancel.
A function for the P&L
At one half every hour is traded, and the model earns 879,112 kroner after costs. At 0.6 the hours near one half are left out, and it earns 957,809.
The threshold, in kroner play
Each trade earns or loses the move and pays 50 kroner. At 0.64 the model trades 6,225 of the 8,663 hours and earns 975,120 kroner, the most of any threshold.
The cost of trading play
The best threshold rises with the cost: 0.53 with no cost, 0.64 at 50 kroner and 0.77 at 150. At 150, one half earns 12,812 kroner and 0.77 earns 468,445.
Your turn 2
Choose the threshold on 2022 and 2023 instead, at a cost of 50. Fill earned with what pnl gives on the training rows at each threshold, and find the best.
Your turn 2: answer
On 2022 and 2023, 0.55 earns the most, and in 2024 it earns 928,247 kroner. That is 95 percent of the best threshold in hindsight, 0.64 with 975,120.
What the P&L leaves out
The cost of 50 kroner per MWh is a round number for fees and the bid-ask spread, not a measured one.
The size of 1 MWh moves no price. A large bet placed in the auction would move the price against itself.
The contract that pays the change from one day to the next at one hour does not exist. The bet stands in for a buyer who can move use between days.
The forecast in the file comes out at 18:00, after the auction, so the model saw a slightly better forecast than a bidder has.
5 · The crisis in the training rows
Part 5
A second label on the level of the price, an hour above 1,000 kroner, fitted with and without 2022, and its probabilities checked against 2024.
Prices above 1,000 kroner
In 2022, 70 percent of the hours cost more than 1,000 kroner, and in 2024, 6 percent. The share that rose from the day before stayed near half in every year.
Two training windows
With 2022 and 2023 the model expects 40 percent of 2024’s hours above 1,000 kroner, and with 2023 alone 13; the share was 6.
Predicted against actual play
Each dot is a group of 2024’s hours. With 2022 in training, a probability near 0.3 meant 0.8 percent; with 2023 alone, 15 percent.
AUC against the Brier score
Both models rank 2024’s hours equally well, with AUCs of 0.839 and 0.838. Only the Brier score shows the difference: 0.187 against 0.062.
Handling a changed market
A recent window 2023 alone forecast 2024 better than 2022 and 2023 together: a Brier score of 0.062 against 0.187.
Watch the average Compare the mean probability with the share that happened, month by month, and retrain when the gap grows.
A label that travels The direction model, trained on the same years, gave 2024 an average probability of 0.495; the share that rose was 0.497.
6 · Similar hours
Part 6
Three classes, a big move either way, the k most similar hours of the past, a feature lab, and your forecasts revised and scored.
Three classes
pd.cut makes three classes: more than 50 kroner down, less than 50 either way, and more than 50 up. The majority rule scores 0.381 and the model 0.606.
The three-class confusion matrix
Rows are what happened, from lower to higher. The model never predicts about the same: in no hour of 2024 is it the most likely of the three.
A big move either way play
AUC on 2024
A move of more than 150 kroner is most likely when the wind forecast changes a lot, either way. A logistic regression on the wind change can only slope one way.
The size of the wind change
abs builds the size of the wind change, a shape a linear model cannot make from the change itself. The AUC for a big move rises from 0.559 to 0.670.
The k nearest hours play
k-NN finds the k hours of 2022 and 2023 most like this one and reports the share that rose. Untick the scaler, and the weekday stops counting.
k-NN in code
k-NN needs no weekday columns: the nearest hours to a Monday are Mondays. With k of 201, chosen on the folds, it scores 0.844 against the logistic regression’s 0.833.
k-NN without the scaler
Without the scaler the AUC falls to 0.797, since the wind change spreads over thousands of megawatts and the weekday over seven values.
The feature lab play
AUC on the folds of 2022 and 2023, where the columns are chosen. Dashed: the model on the slides.
The same columns for k-NN, and for a big move either way. The dashed lines are the models on the slides, and they can be beaten.
Your forecasts, revised play
| tomorrow, at the hour | wind change, MW | today's move, kr | your first answer | your answer now |
|---|
An answer you leave alone stays as it was.
You have now seen what moves the price: the wind change, the weekday and today’s move. Change any forecast you like; your first answers are kept.
The scoreboard
Both scores are losses, so lower is better. The log loss punishes a confident wrong answer hardest, as on 2 January.
Everything used today
Looking at a market read_csv with parse_dates, set_index, .loc by date, groupby by year and by hour, pd.cut into bands, a bar chart and two lines.
Loops, dictionaries, functions A dictionary of medians filled by a loop, a loop that adds the weekday columns, a ladder of models in a dictionary, and pnl on two sets of rows.
A label from the day before shift(1) inside groupby('hour') puts the same hour of the day before on every row. About half the hours rose, in every year.
Columns built from others The wind change gave an AUC of 0.796, the weekday as seven columns 0.830, and today’s move 0.833.
The threshold and the cost The best threshold rose with the cost. Chosen on 2022 and 2023, 0.55 earned 928,247 kroner in 2024 at 50 kroner a trade.
Training rows from another market Trained through 2022, the model expected 40 percent of 2024’s hours above 1,000 kroner. The share was 6 percent.
A shape a line cannot make The size of the wind change took a big move’s AUC from 0.559 to 0.670, and k-NN found the shape by itself.
k-NN and the scoreboard The weekday and the hour as plain numbers, scaled: an AUC of 0.844. On your eight hours k-NN scored 0.166 and logistic regression 0.194.
Where this goes next
beforelogistic regression, thresholds and costs, calibration, three classes and k-NNclassification
nowone market from the auction to the P&L, with every tool so fara recap
nexttrees and ensembles, for numbers and for labelsthe same workflow
The label, the split, the folds, the threshold and the scores stay exactly as they were today. Only the model inside them changes.
Before the next session
- There are no exercises and no case this time. Open the deck at home: beat the models on the slides in the feature lab, and change the live cells, with 2023 as the test year or another k.
- Finish any earlier exercise set you skipped. The loops, functions and masks in the early sets carried every step today.
- Read the case notebooks for Parts 8 and 9 again in one sitting, as one classification investigation.
Stuck? Ask a friend, ask an AI for a hint rather than an answer, or email jobo@econ.au.dk.