The two cases with trees
Machine Learning in Finance · Session 13
The two cases
A house in Aarhus V
Session 7 valued every 2024 sale with linear regression in logs on 28 columns. It missed by 1.26 million kroner, with 15 percent of the loans underwater.
An hour in West Denmark
Session 10 asked whether tomorrow’s price at an hour beats today’s. Logistic regression ranked the hours of 2024 with an AUC of 0.833, and k-NN with 0.844.
Both sessions came before trees, forests and boosting. Today the same tables, splits and scores go to those models.
Trees on the course tables
| table | the linear model | a forest | boosted trees |
|---|---|---|---|
| volatility, test RMSE | 0.218, ridge | 0.226 | 0.217 and 0.225 |
| credit, test AUC | 0.748, logistic regression | 0.777 | 0.777 |
On the volatility table the trees drew level with ridge. On the credit table they gained 0.029 of AUC. The two cases are two more tests.
Today
- the house in Aarhus V: a tree, a forest and boosted trees on the 2024 sales
- the hours of West Denmark: the same models on tomorrow’s price
- choosing a model: accuracy, compute and explanations
- the course and the exam, then your questions
There are no exercises and no case for this session.
1 · The house in Aarhus V
Part 1
Session 7’s valuation of every 2024 sale, against a tree, a forest and boosted trees.
The house
150 m²
living area
1973
year built
5
rooms
villa
type
Aarhus V
postal town
3.6 km
from the cathedral
It sold for 3,800,000 kroner in January 2024. Session 7’s model valued it at 4,341,389, 14 percent above the price.
The libraries of the course
NumPy and pandas came in Session 3, the linear models between Sessions 5 and 9, the trees in Session 11 and XGBoost in Session 12.
The table and the split
These are the same sales as in Session 7: 6,212 from 2021 to 2023 to learn from, and the 1,409 of 2024 to check on.
Two scores
The first is the error in kroner. The second is the share of 2024 sales where a loan of 80 percent of the valuation is more than the price.
Session 7’s valuation
Ridge in logs, with alpha chosen on the folds: 1,257,437 kroner, and 15.1 percent of the loans underwater. Every new model is held to these two numbers.
A tree
Leaves of at least 20 sales were chosen on the folds. The tree is 13,000 kroner worse than ridge and puts 13.8 percent of the loans underwater.
A forest
A hundred trees, each grown on a bootstrap sample and averaged, cut the error by 144,000 kroner to 1,113,028. The underwater share falls to 12.1 percent.
Boosted trees, stopped on 2023
Depth 3 and 974 trees did best on the 2023 sales. Refitted on all three years, the model misses by 1,166,375 kroner, with 11.6 percent underwater.
Prices inside one town
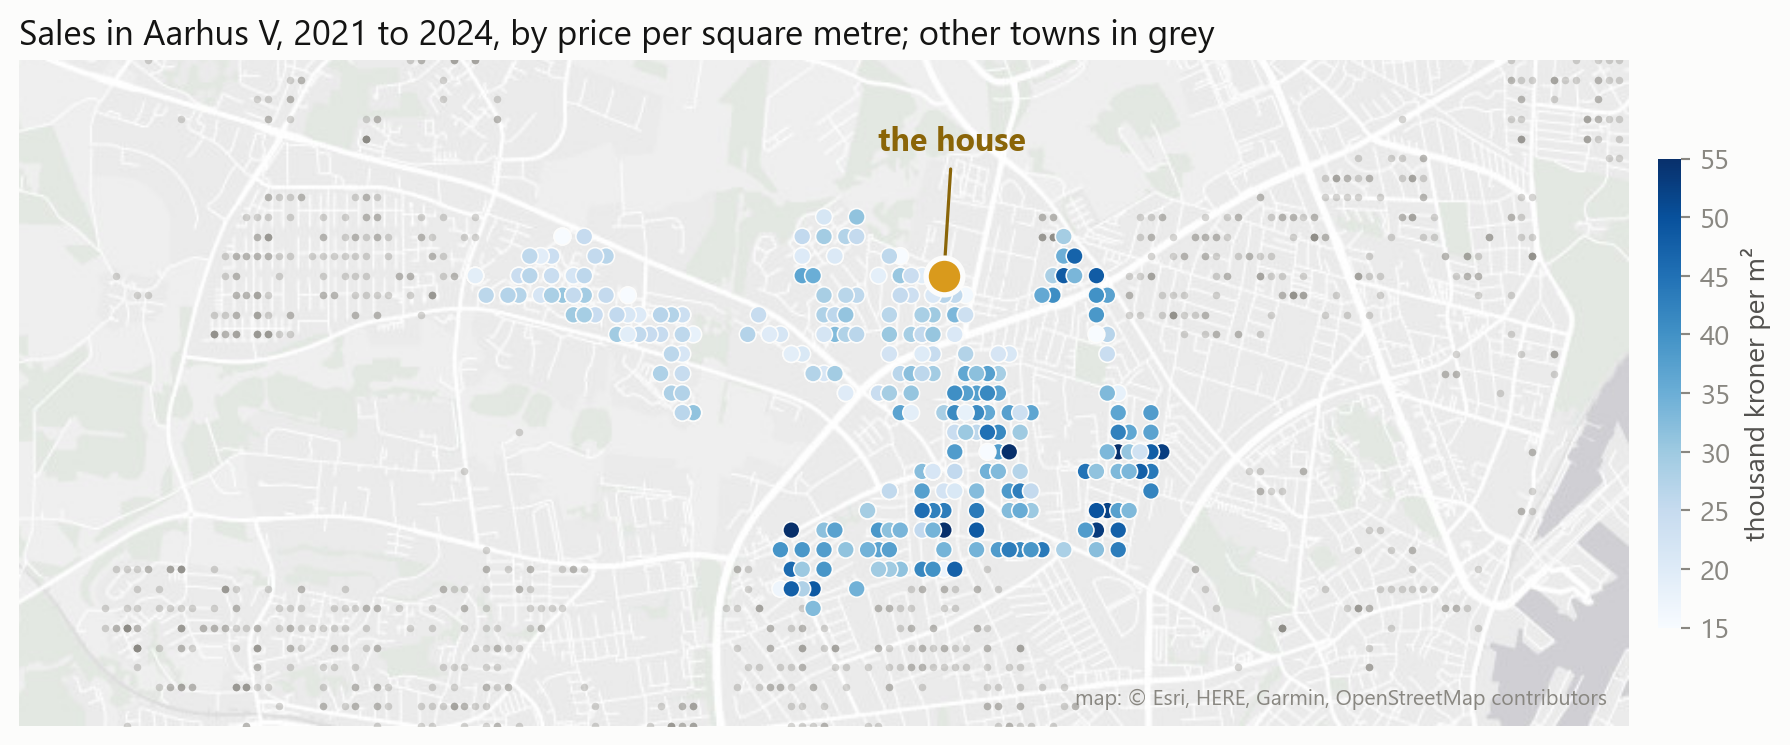
Every house in Aarhus V gets the same town premium, yet one sale in ten there went below 21,500 kroner per square metre and one in ten above 44,900.
Coordinates as columns
Latitude and longitude replace the 22 town columns, and depth 4 did best on 2023. The error falls to 1,030,321 kroner and the underwater share to 9.9 percent.
The house anywhere in the inner city play
the house valued here, million kroner
map: © Esri, HERE, Garmin, OpenStreetMap contributors
Each square is the house, moved there. Linear regression on the same columns can only tilt the map and follow the distance, and misses by 1.31 million.
The error, model by model
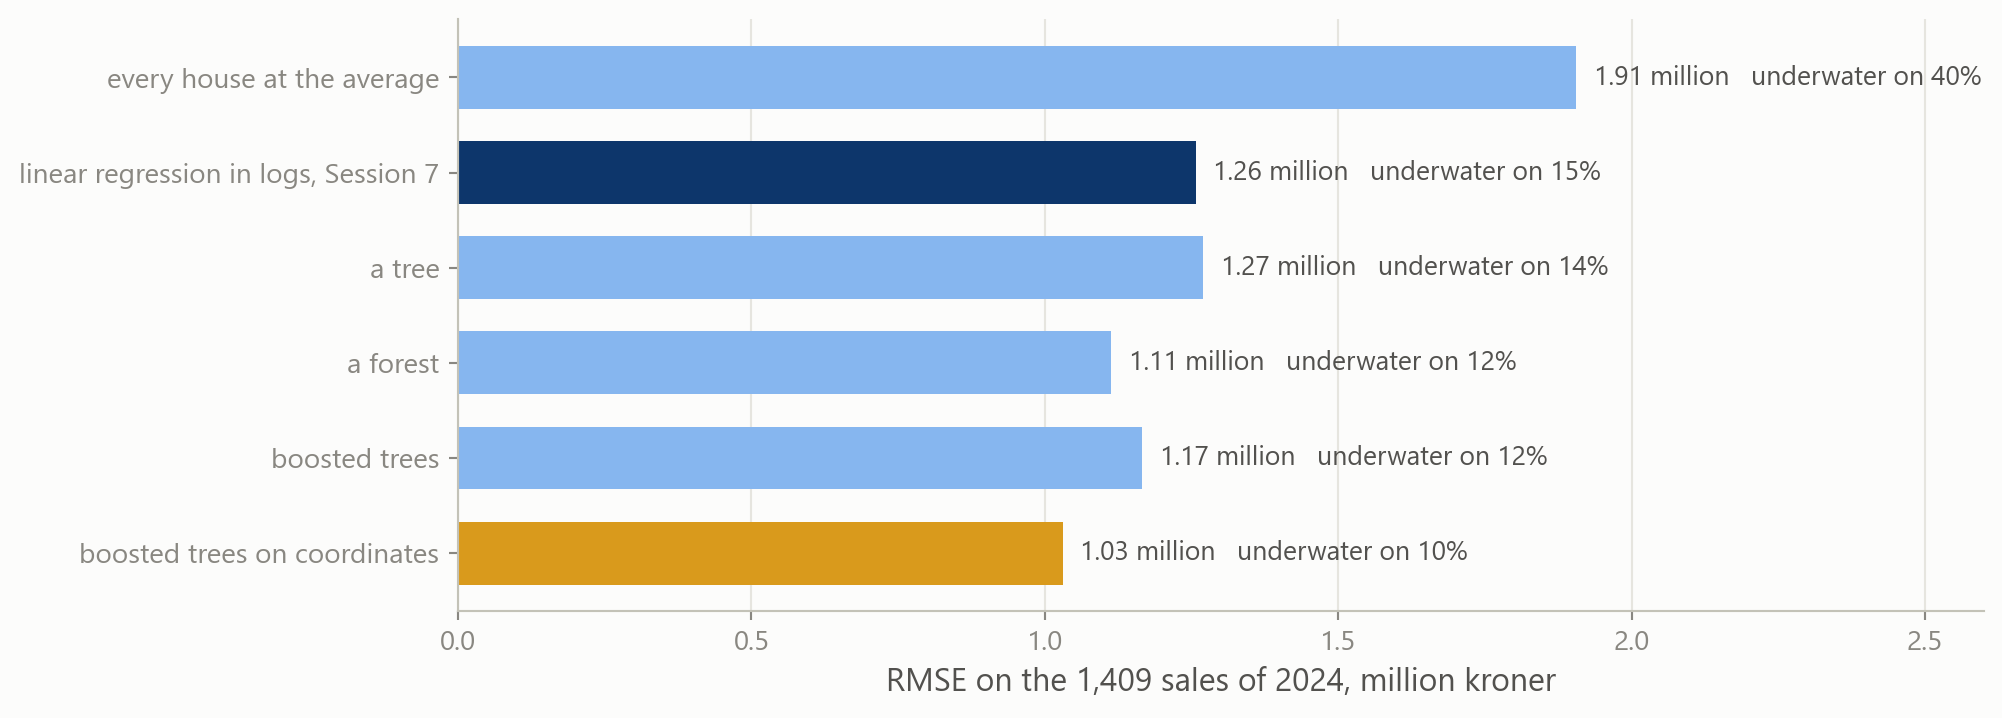
The forest and both boosted models beat ridge. Boosting on coordinates cuts the underwater share from 15 percent to 10.
The house, valued by every model
Boosted trees on coordinates came closest on this house, 58,781 kroner below the price. One house says little; the scores on the 1,409 sales say more.
2 · Tomorrow’s price at this hour
Part 2
Session 10’s question on the same 2024 hours, with the same scores, and with a forest and boosted trees.
The question, again
0.833
logistic regression, AUC on 2024
0.844
k-NN, AUC on 2024
957,809 kr
logistic regression, trading 2024 at a threshold of 0.6
An hour is up when its price is higher than at the same hour the day before. These were Session 10’s best models of that label.
The hours, as in Session 10
The columns are built as in Session 10, with the weekday as seven columns: 17,422 hours to learn from and 8,663 to check on.
Boosted trees on the same columns
Depth 3 and 319 trees did best on 2023. The trees match k-NN on 2024, 0.843 against 0.844, and do no better than logistic regression on the folds.
Today’s price and the wind
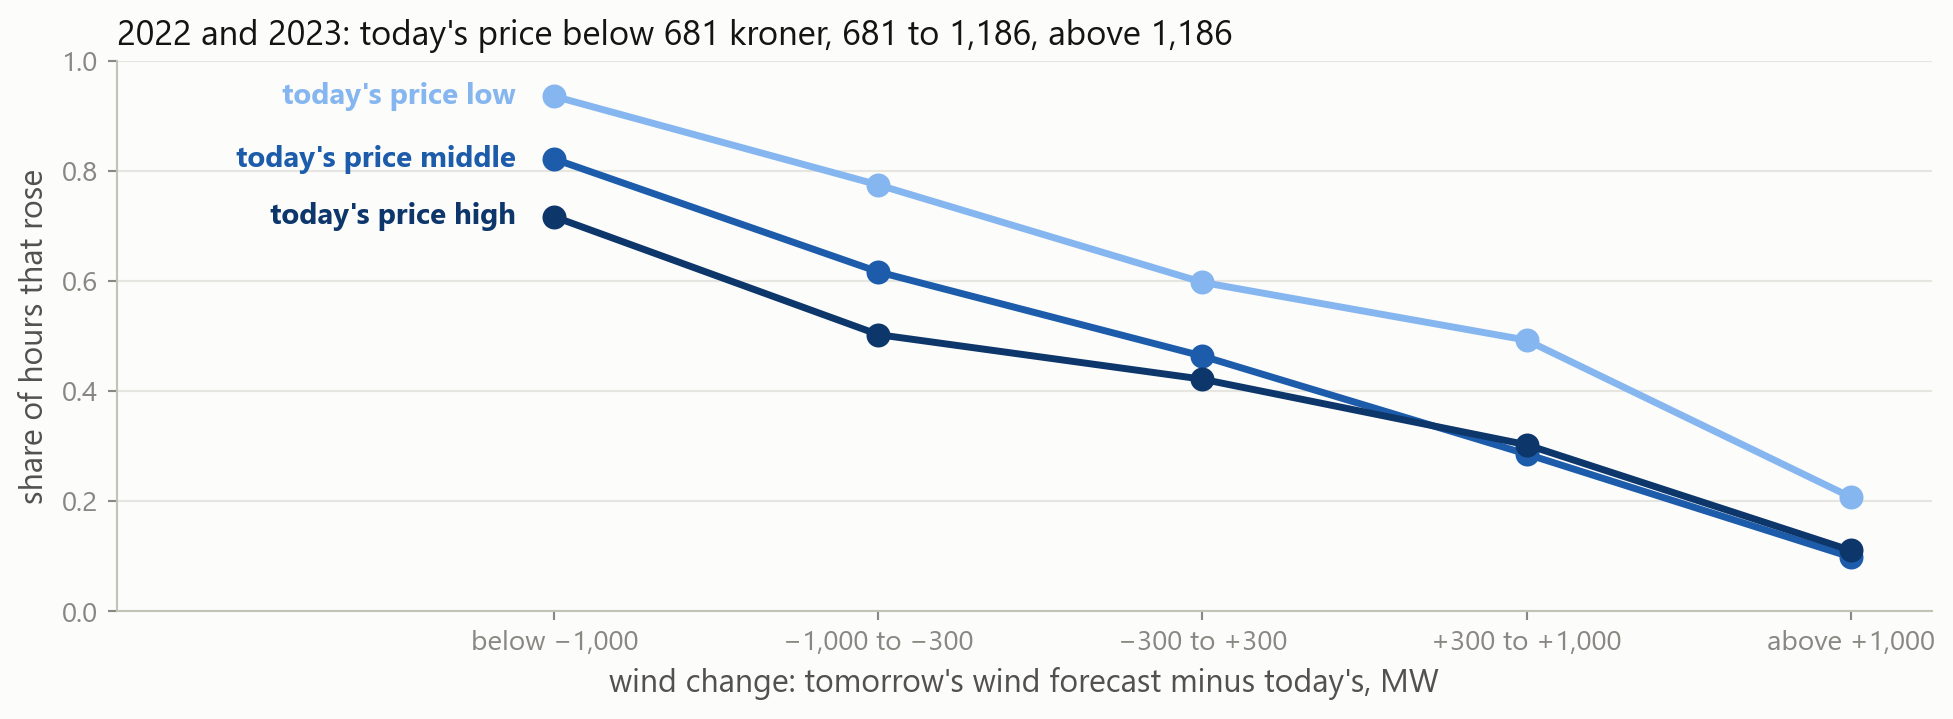
After a forecast fall of over 1,000 MW, 94 percent of hours rose when today’s price was low and 72 percent when it was high.
Three more columns
The trees now also see today’s price and the wind and sun forecasts themselves. With 58 trees of depth 4, chosen on 2023, the AUC rises to 0.856.
Your turn 1
Give logistic regression the same three columns. How much does it gain, and why does it gain less than the trees?
features is Session 10’s list, which scored 0.833. Replace both [...] with the three new columns.
Your turn 1: answer
The AUC is 0.836, up 0.003, where the trees gained 0.014. Logistic regression keeps one slope for the wind change at every price level; the trees need not.
The P&L in 2024
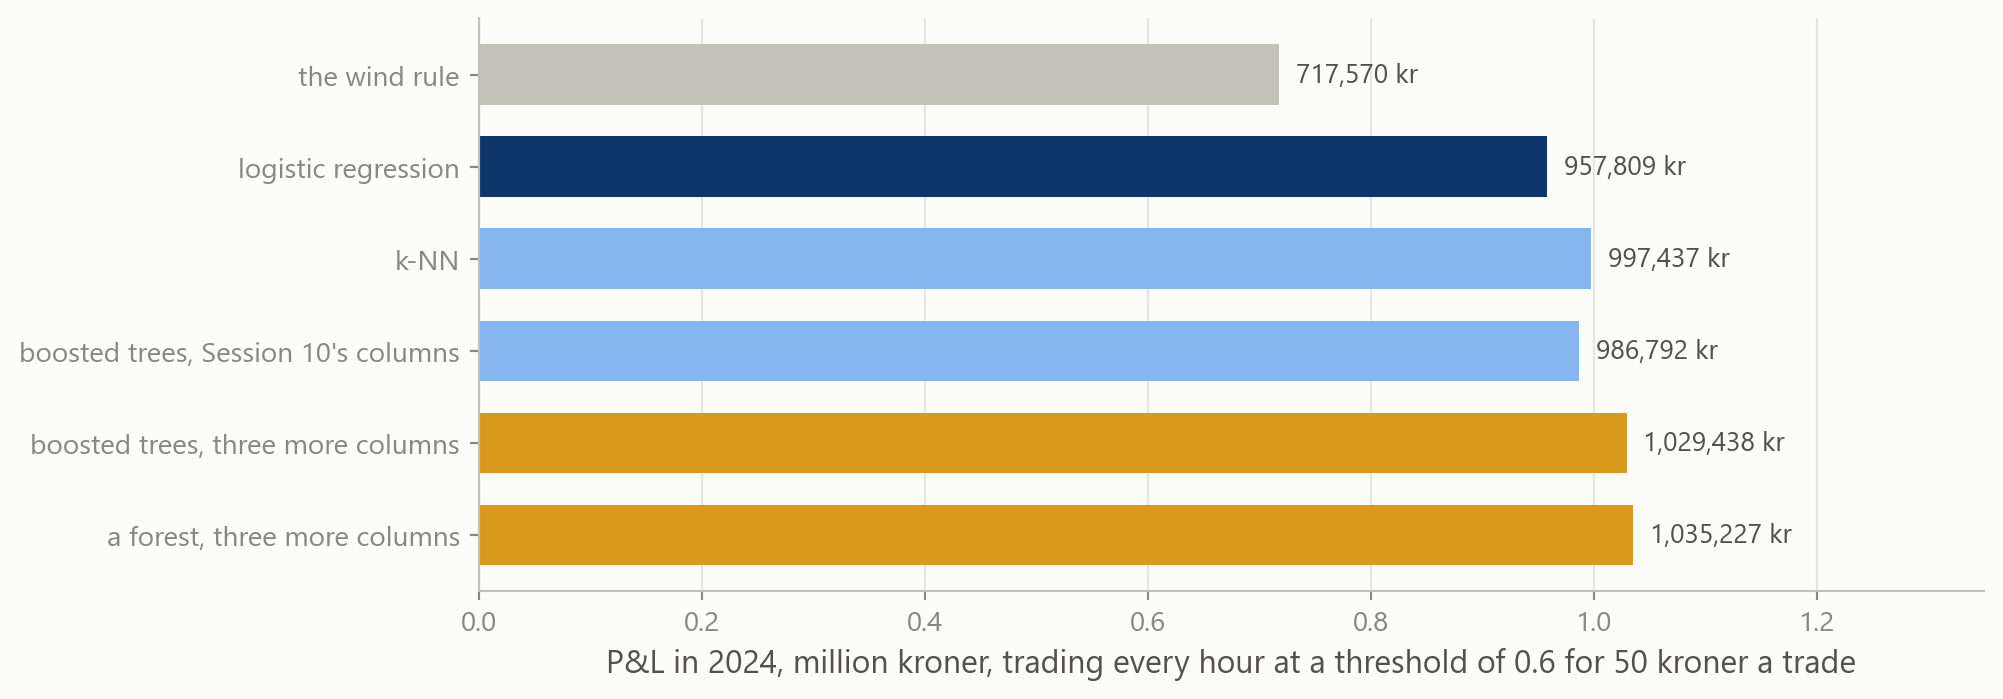
The wind rule trades at one half, the models at 0.6. The forest earns 77,418 kroner more than logistic regression in 2024.
Your eight hours, again
Of the four models, k-NN has the lowest Brier score here and the forest the lowest log loss. Eight hours cannot separate models 0.01 of AUC apart.
3 · Choosing a model
Part 3
When a more flexible model does better, what it costs to fit and to run, and what it can explain.
Four tables, four answers
| table | rows to learn from | the linear model | the best trees | the change |
|---|---|---|---|---|
| volatility, test RMSE | 1,894 days | ridge 0.218 | boosted trees 0.217 | none |
| credit, test AUC | 21,000 borrowers | logistic regression 0.748 | a forest 0.777 | +0.029 |
| houses, test RMSE | 6,212 sales | ridge 1.26 million | boosted, coordinates 1.03 million | -18 percent |
| hours, test AUC | 17,422 hours | logistic regression 0.833 | a forest 0.857 | +0.024 |
The trees gained most where location or a changing slope matters, and nothing where the target is mostly noise around a straight line.
Where the trees gained
A map The town columns hold one premium per town. Boosted trees cut the coordinates into districts and took 18 percent off the error.
A slope that changes A fall in the wind raises tomorrow’s price less often when today’s price is high. A linear model has one slope for it.
Steps On the credit table the default rate jumps from 12 to 30 percent at the first month late. A tree’s cut takes a step like that directly.
Mostly noise Next month’s volatility is close to this month’s plus noise. On 1,894 days the trees only matched ridge.
The time to fit and to predict
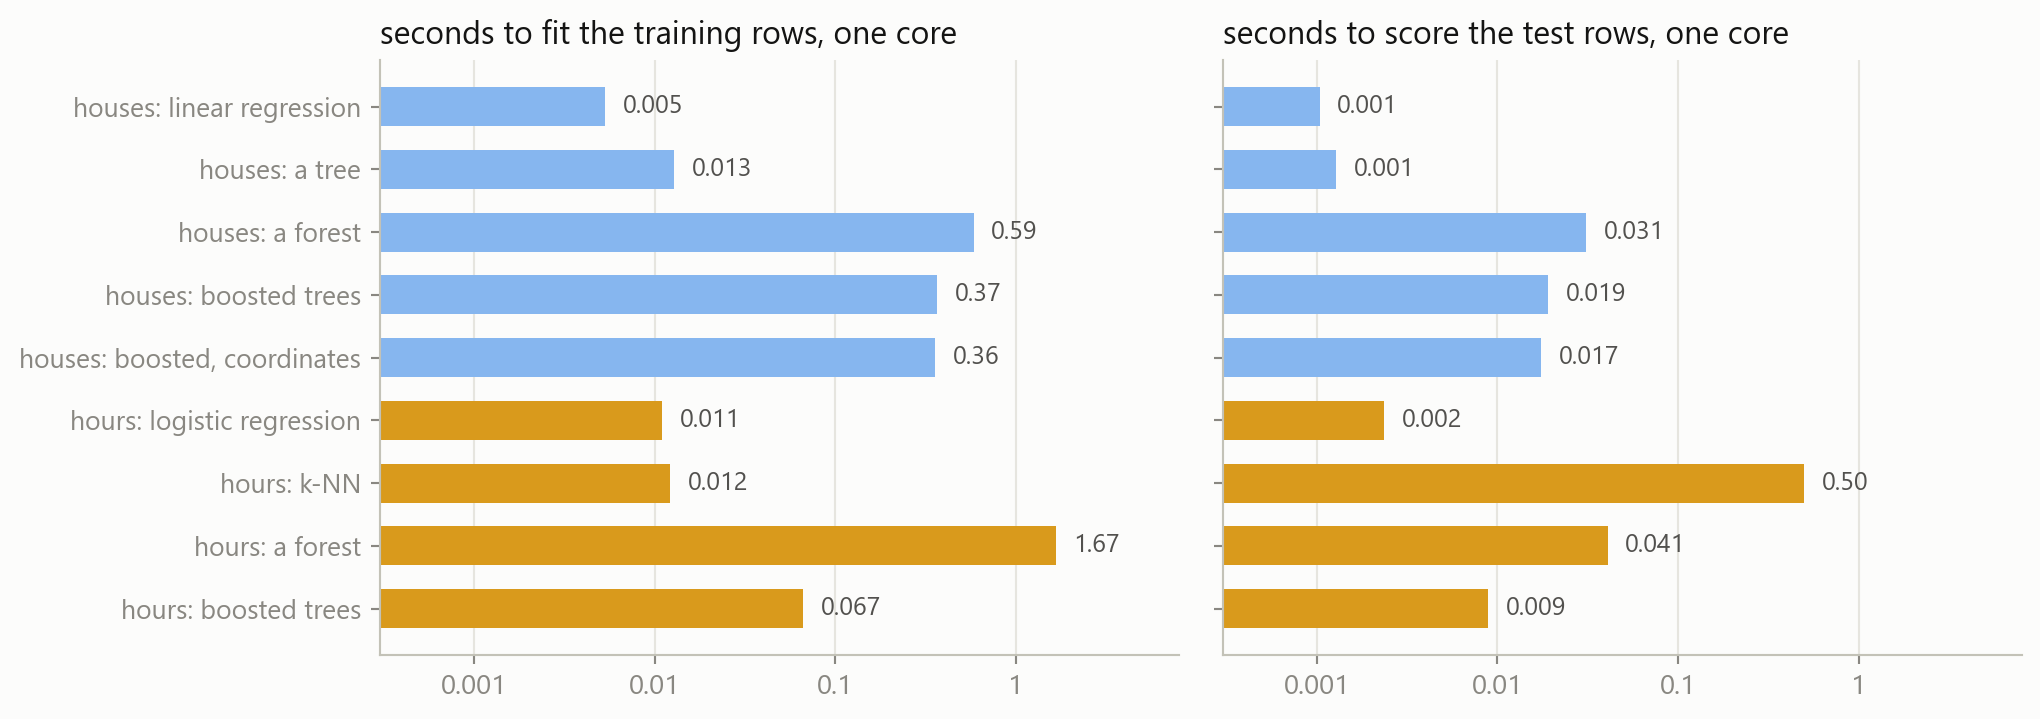
k-NN fits at once but takes half a second to score 2024; the forest takes over a second to fit. A grid of settings multiplies every fit.
Two fits, timed predict
Before you run it: which of the two takes longer in your browser, and by how much? Both models score about 0.857 on 2024.
Thirty more square metres
In logs, linear regression adds 14.7 percent to every house. Boosted trees add between 8 and 35 percent, depending on the house and where it stands.
A bigger house play
Boosted trees value the house lower at some larger areas, and the forest stops rising beyond the largest sales it learned from.
Monotone constraints
monotone_constraints lets the value only rise with the area. Every one of 200 test houses had a fall before and none has one now, for 33,000 kroner of RMSE.
Explanations in credit
The EU’s AI Act counts models that score the creditworthiness of people as high-risk. A person refused on such a score may ask for the main elements of the decision.
A coefficient states the same reason for every customer. A sum of a thousand trees has to be explained one decision at a time.
Regulation (EU) 2024/1689 (the AI Act), Annex III, point 5(b), and Article 86(1).
The trade-offs, model by model
| model | houses: RMSE, and seconds to fit | hours: AUC, and seconds to fit | one prediction comes from | beyond the training rows |
|---|---|---|---|---|
| linear or logistic regression | 1.26 million, 0.005 s | 0.833, 0.011 s | one coefficient per column | the slope continues |
| k-NN | 0.844, 0.012 s; 0.50 s to predict | the nearest training rows | the nearest training rows | |
| a tree | 1.27 million, 0.013 s | a path of up to 19 questions | the value of a leaf | |
| a forest | 1.11 million, 0.59 s | 0.857, 1.67 s | an average of 100 trees | flat |
| boosted trees | 1.03 million, 0.36 s | 0.856, 0.067 s | a sum of 58 to 1,017 trees | flat |
None of them wins every column. Which one matters depends on who uses the model and how often it is refitted.
Choosing a model
- Score a baseline and a linear model first.
- Fit a forest and boosted trees on the same folds.
- Keep the flexible model only when it wins on the folds and on the test rows.
- Check what it does to one row: its direction, and far from the data.
- Price the compute: fitting, tuning and predicting.
- Ask who has to understand one prediction.
4 · The course, and the exam
Part 4
A look back over thirteen sessions, the exam, and time for your questions.
Thirteen sessions
1 to 3Python: variables, loops, functions and dictionaries; NumPy, pandas and matplotlibthe risk report begins
4features, targets, splits and the scores of a predictionno model yet
5 and 6linear regression, folds, ridge and lassothe volatility forecast
7a house in Aarhus, with every tool so fara case lecture
8 and 9logistic regression, thresholds, costs and k-NNthe jump warning
10tomorrow’s power price in West Denmarka case lecture
11 and 12trees, forests and boosted treesthe report as a whole
13the two cases with treestoday
The routine behind every model
A baseline first The training average, the majority class or persistence. Every score goes next to the baseline’s.
A split that respects time When the rows are days or hours, the test rows come after the training rows.
Settings on validation rows Folds or a later block choose alpha, C, k, the depth and the number of trees.
The test rows once They score the model already chosen, and the folds are reported beside them.
A model read Its coefficients, its importance, or what it does to one row.
A model priced The time to fit and to predict, and who has to understand it.
The exam
180 minutes
on site, offline, in VS Code
Two parts
50 points each
No AI
and no internet; everything else is allowed
Two files
the answer notebook and the blank PDF
Three mock exams and a two-page guide to preparing are on the Exam Info page of the course site.
Before the exam
- While you are online, save the course ZIP, the lecture PDFs and the cheatsheet from the Exam info page.
- Install the course’s packages with the setup page’s one line, then run
setup_check.ipynbfrom the ZIP with Wi-Fi off: it should say ready. - Switch off AI completion in VS Code, as the guide shows. The suggestion list that offers
headafterdf.is allowed and stays on. - Sit one mock exam in three uninterrupted hours, with Wi-Fi and AI switched off.
Questions
Questions about the exam, the course, or anything else
The lectures, the notebooks, the cheatsheet and the mock exams stay on the course site. Email: jobo@econ.au.dk